Monitor Tool
Monitor Tool
1. Prometheus Integration
1.1 Prometheus Metric Mapping
The following table illustrates the mapping of IoTDB metrics to the Prometheus-compatible format. For a given metric with Metric Name = name and tags K1=V1, ..., Kn=Vn, the mapping follows this pattern, where value represents the actual measurement.
| Metric Type | Mapping |
|---|---|
| Counter | name_total{cluster="clusterName", nodeType="nodeType", nodeId="nodeId", k1="V1", ..., Kn="Vn"} value |
| AutoGauge, Gauge | name{cluster="clusterName", nodeType="nodeType", nodeId="nodeId", k1="V1", ..., Kn="Vn"} value |
| Histogram | name_max{cluster="clusterName", nodeType="nodeType", nodeId="nodeId", k1="V1", ..., Kn="Vn"} value name_sum{cluster="clusterName", nodeType="nodeType", nodeId="nodeId", k1="V1", ..., Kn="Vn"} value name_count{cluster="clusterName", nodeType="nodeType", nodeId="nodeId", k1="V1", ..., Kn="Vn"} value name{cluster="clusterName", nodeType="nodeType", nodeId="nodeId", k1="V1", ..., Kn="Vn", quantile="0.5"} value name{cluster="clusterName", nodeType="nodeType", nodeId="nodeId", k1="V1", ..., Kn="Vn", quantile="0.99"} value |
| Rate | name_total{cluster="clusterName", nodeType="nodeType", nodeId="nodeId", k1="V1", ..., Kn="Vn"} value name_total{cluster="clusterName", nodeType="nodeType", nodeId="nodeId", k1="V1", ..., Kn="Vn", rate="m1"} value name_total{cluster="clusterName", nodeType="nodeType", nodeId="nodeId", k1="V1", ..., Kn="Vn", rate="m5"} value name_total{cluster="clusterName", nodeType="nodeType", nodeId="nodeId", k1="V1", ..., Kn="Vn", rate="m15"} value name_total{cluster="clusterName", nodeType="nodeType", nodeId="nodeId", k1="V1", ..., Kn="Vn", rate="mean"} value |
| Timer | name_seconds_max{cluster="clusterName", nodeType="nodeType", nodeId="nodeId", k1="V1", ..., Kn="Vn"} value name_seconds_sum{cluster="clusterName", nodeType="nodeType", nodeId="nodeId", k1="V1", ..., Kn="Vn"} value name_seconds_count{cluster="clusterName", nodeType="nodeType", nodeId="nodeId", k1="V1", ..., Kn="Vn"} value name_seconds{cluster="clusterName", nodeType="nodeType", nodeId="nodeId", k1="V1", ..., Kn="Vn", quantile="0.5"} value name_seconds{cluster="clusterName", nodeType="nodeType", nodeId="nodeId", k1="V1", ..., Kn="Vn", quantile="0.99"} value |
1.2 Configuration File
To enable Prometheus metric collection in IoTDB, modify the configuration file as follows:
- Taking DataNode as an example, modify the iotdb-system.properties configuration file as follows:
dn_metric_reporter_list=PROMETHEUS
dn_metric_level=CORE
dn_metric_prometheus_reporter_port=9091- Start IoTDB DataNodes
- Use a web browser or
curlto accesshttp://server_ip:9091/metricsto retrieve metric data, such as:
...
# HELP file_count
# TYPE file_count gauge
file_count{name="wal",} 0.0
file_count{name="unseq",} 0.0
file_count{name="seq",} 2.0
...
1.3 Prometheus + Grafana Integration
IoTDB exposes monitoring data in the standard Prometheus-compatible format. Prometheus collects and stores these metrics, while Grafana is used for visualization.
Integration Workflow
The following picture describes the relationships among IoTDB, Prometheus and Grafana:
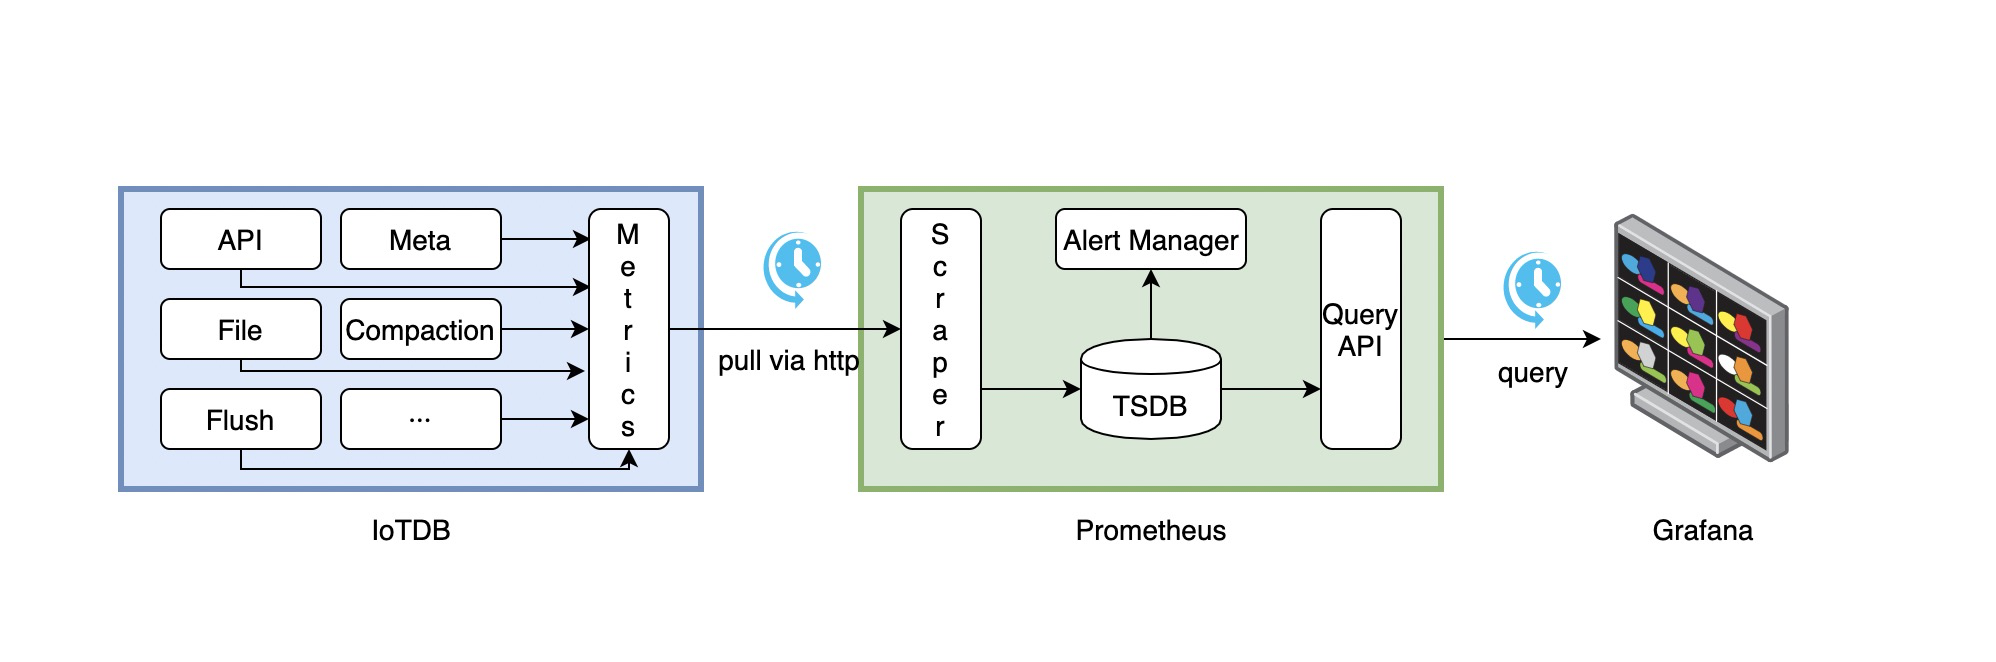
Iotdb-Prometheus-Grafana Workflow
- IoTDB continuously collects monitoring metrics.
- Prometheus collects metrics from IoTDB at a configurable interval.
- Prometheus stores the collected metrics in its internal time-series database (TSDB).
- Grafana queries Prometheus at a configurable interval and visualizes the metrics.
Prometheus Configuration Example
To configure Prometheus to collect IoTDB metrics, modify the prometheus.yml file as follows:
job_name: pull-metrics
honor_labels: true
honor_timestamps: true
scrape_interval: 15s
scrape_timeout: 10s
metrics_path: /metrics
scheme: http
follow_redirects: true
static_configs:
  - targets:
      - localhost:9091
For more details, refer to:
- Prometheus Documentation:
- Grafana Documentation:
2. Apache IoTDB Dashboard
We introduce the Apache IoTDB Dashboard, designed for unified centralized operations and management, which enables monitoring multiple clusters through a single panel.
You can access the Dashboard's Json file in TimechoDB.
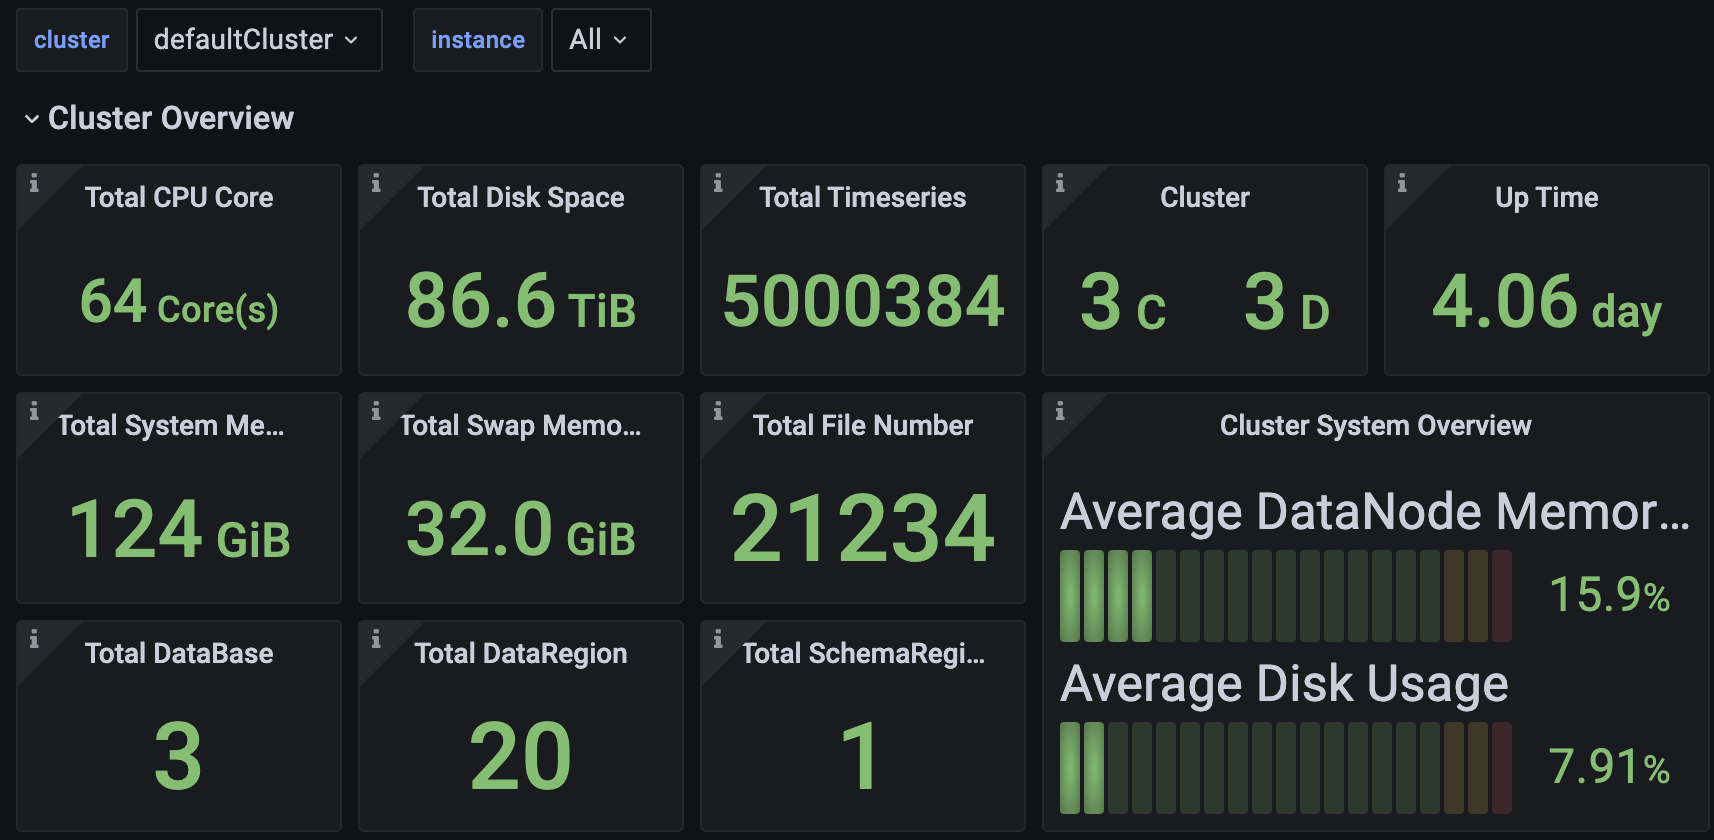
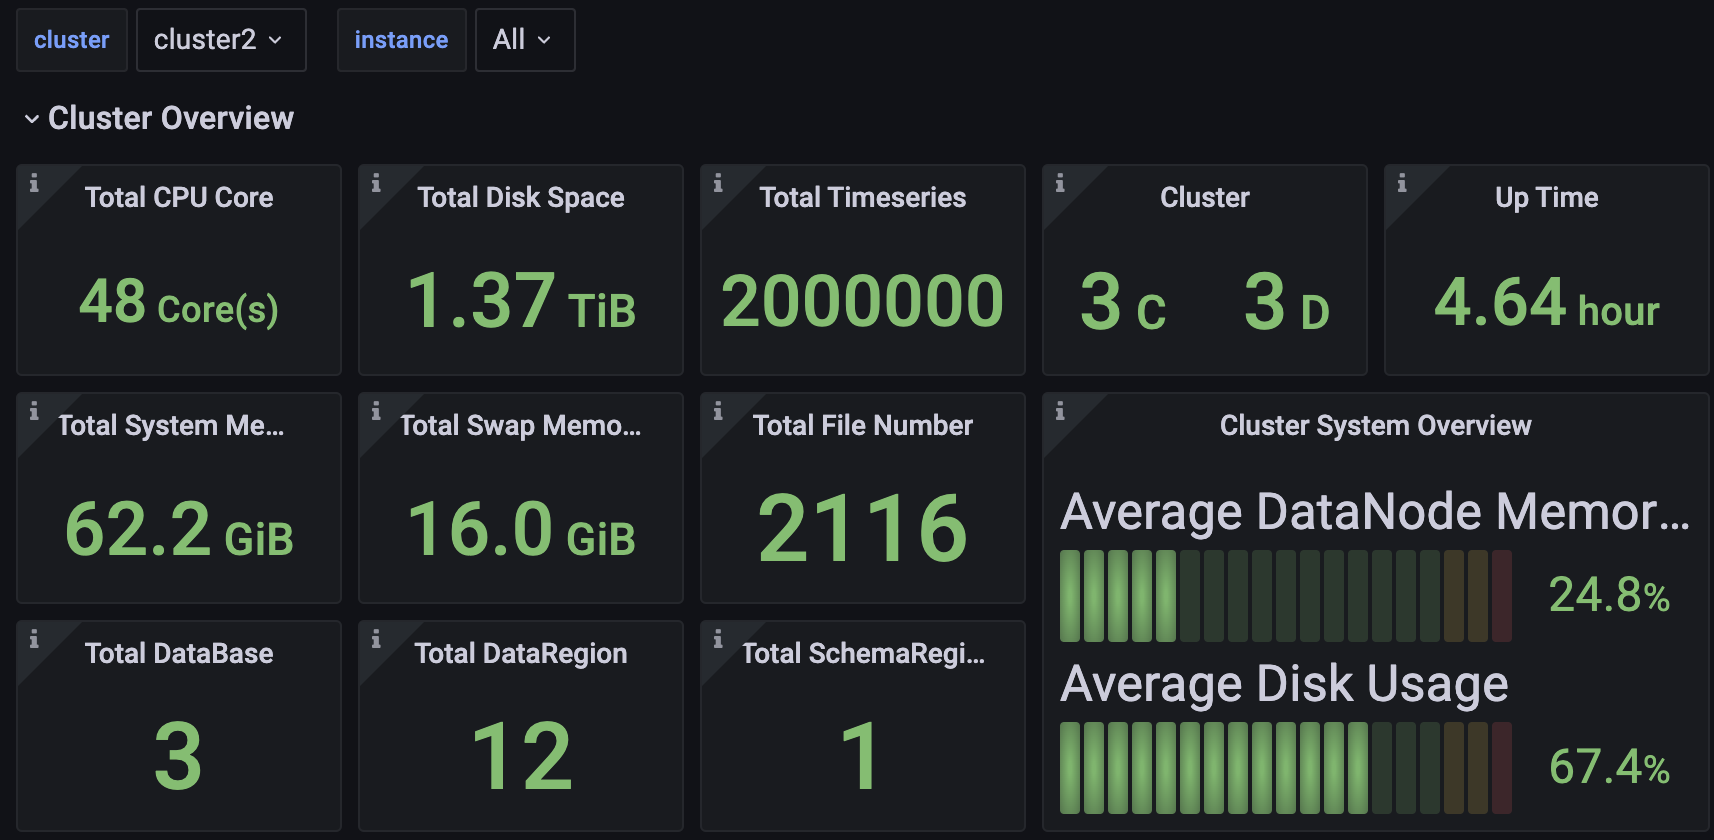
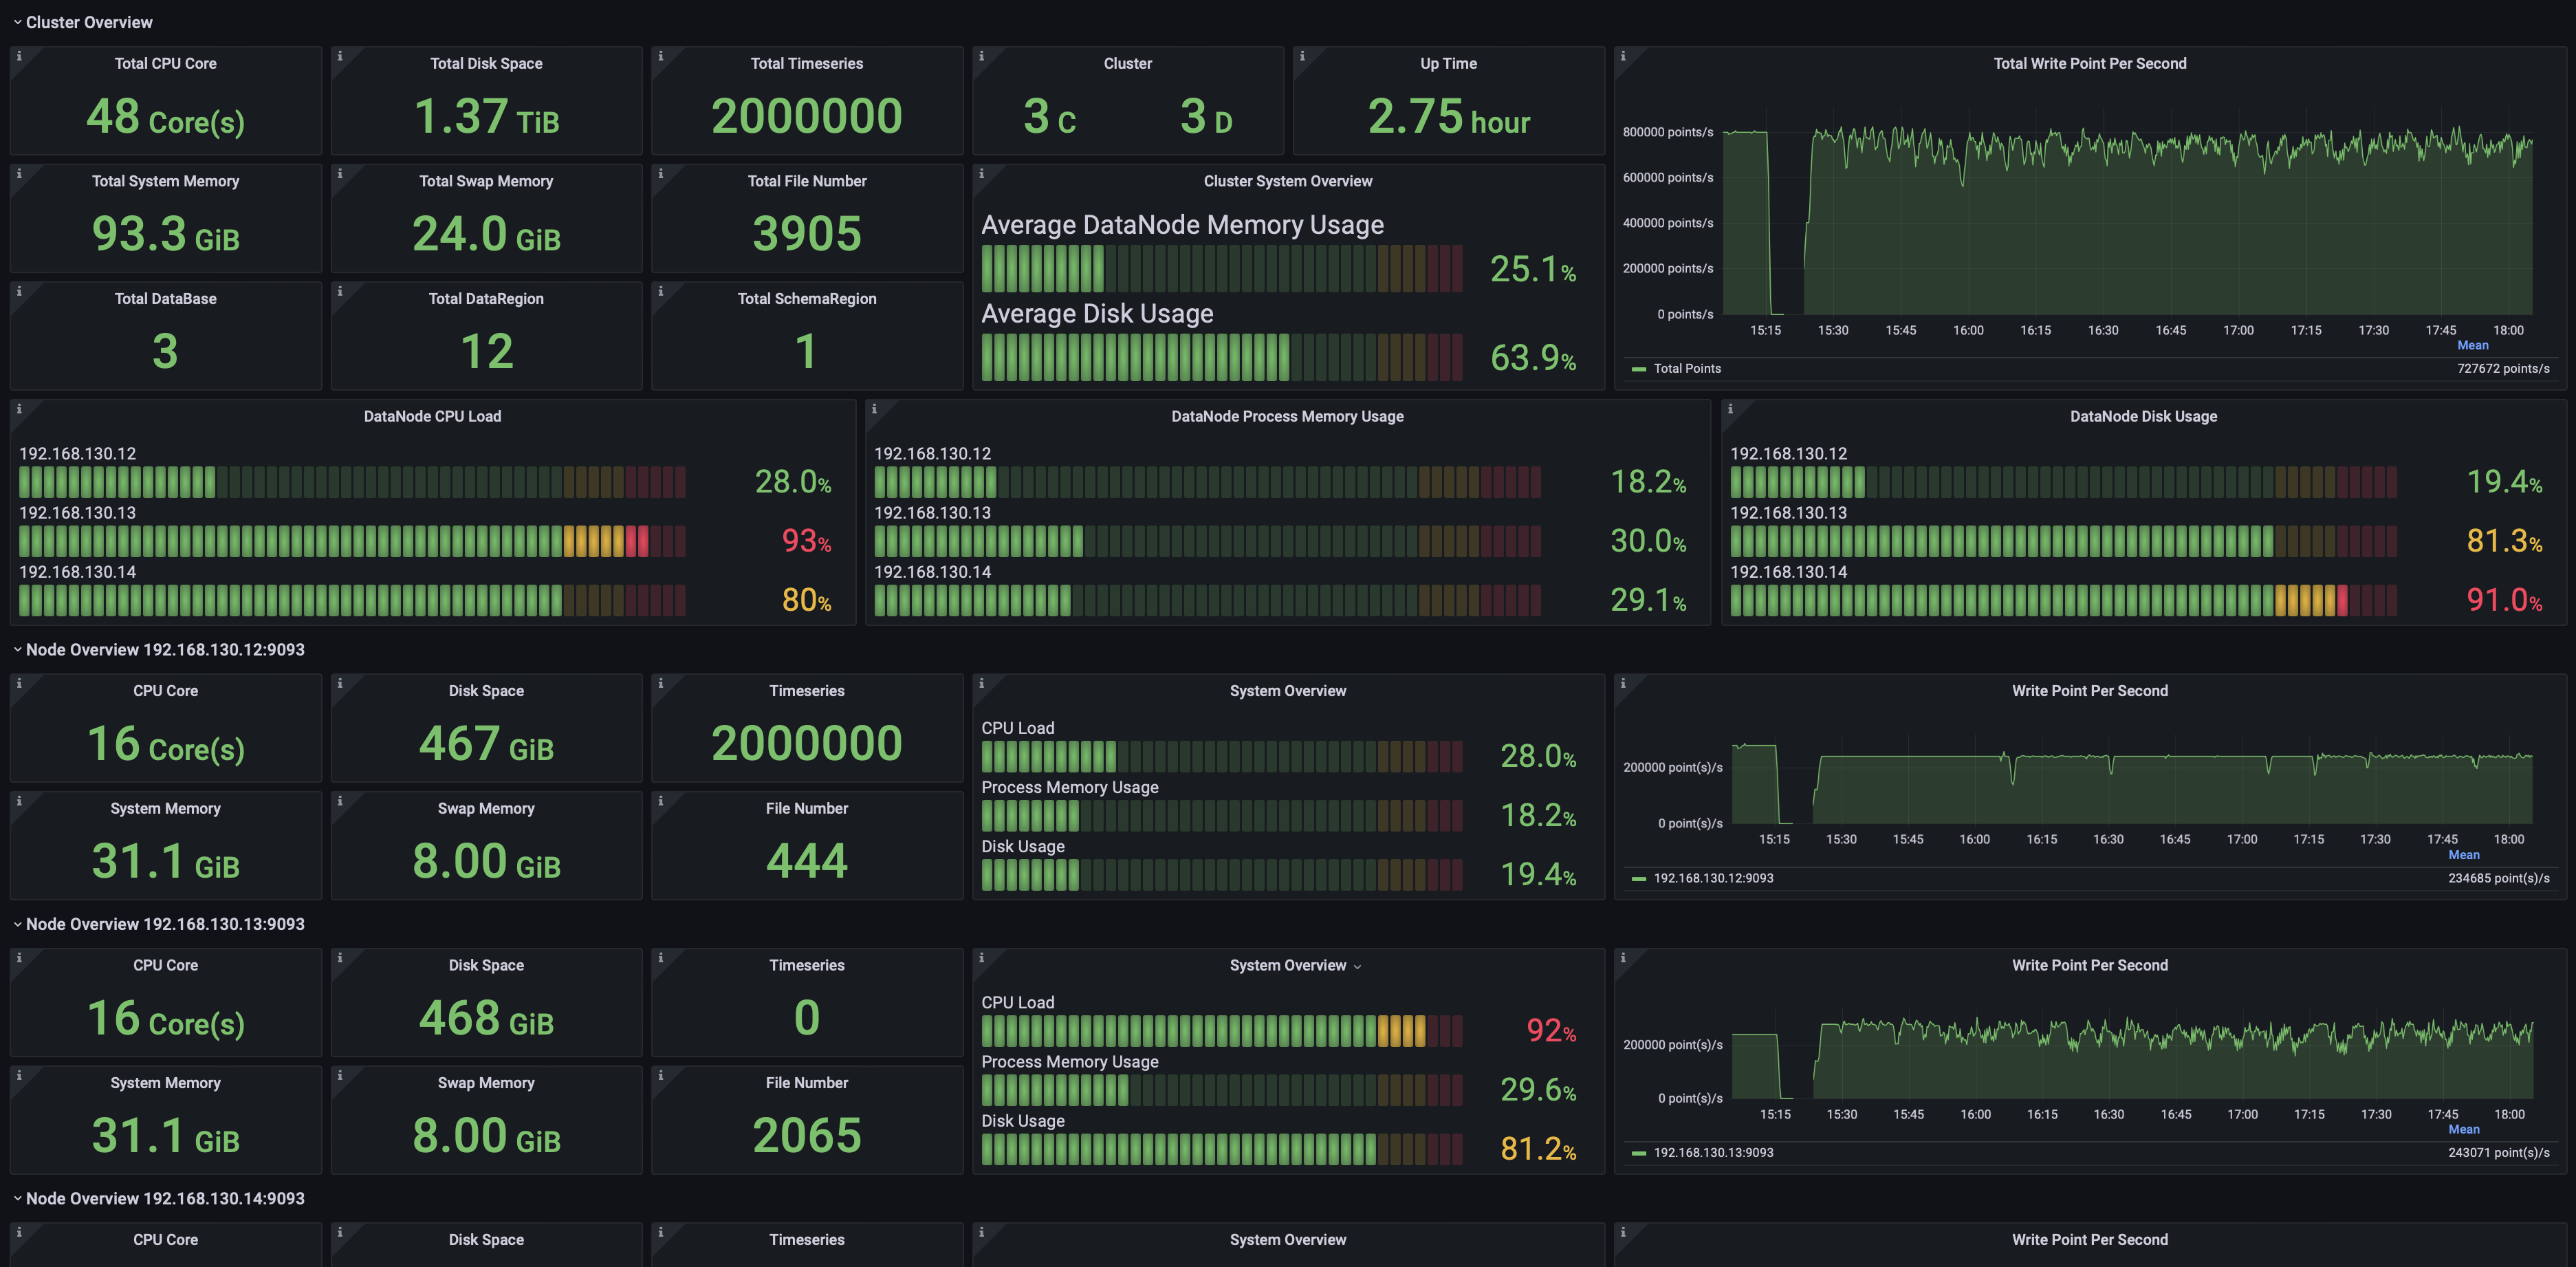
2.1 Cluster Overview
Including but not limited to:
- Total number of CPU cores, memory capacity, and disk space in the cluster.
- Number of ConfigNodes and DataNodes in the cluster.
- Cluster uptime.
- Cluster write throughput.
- Current CPU, memory, and disk utilization across all nodes.
- Detailed information for individual nodes.
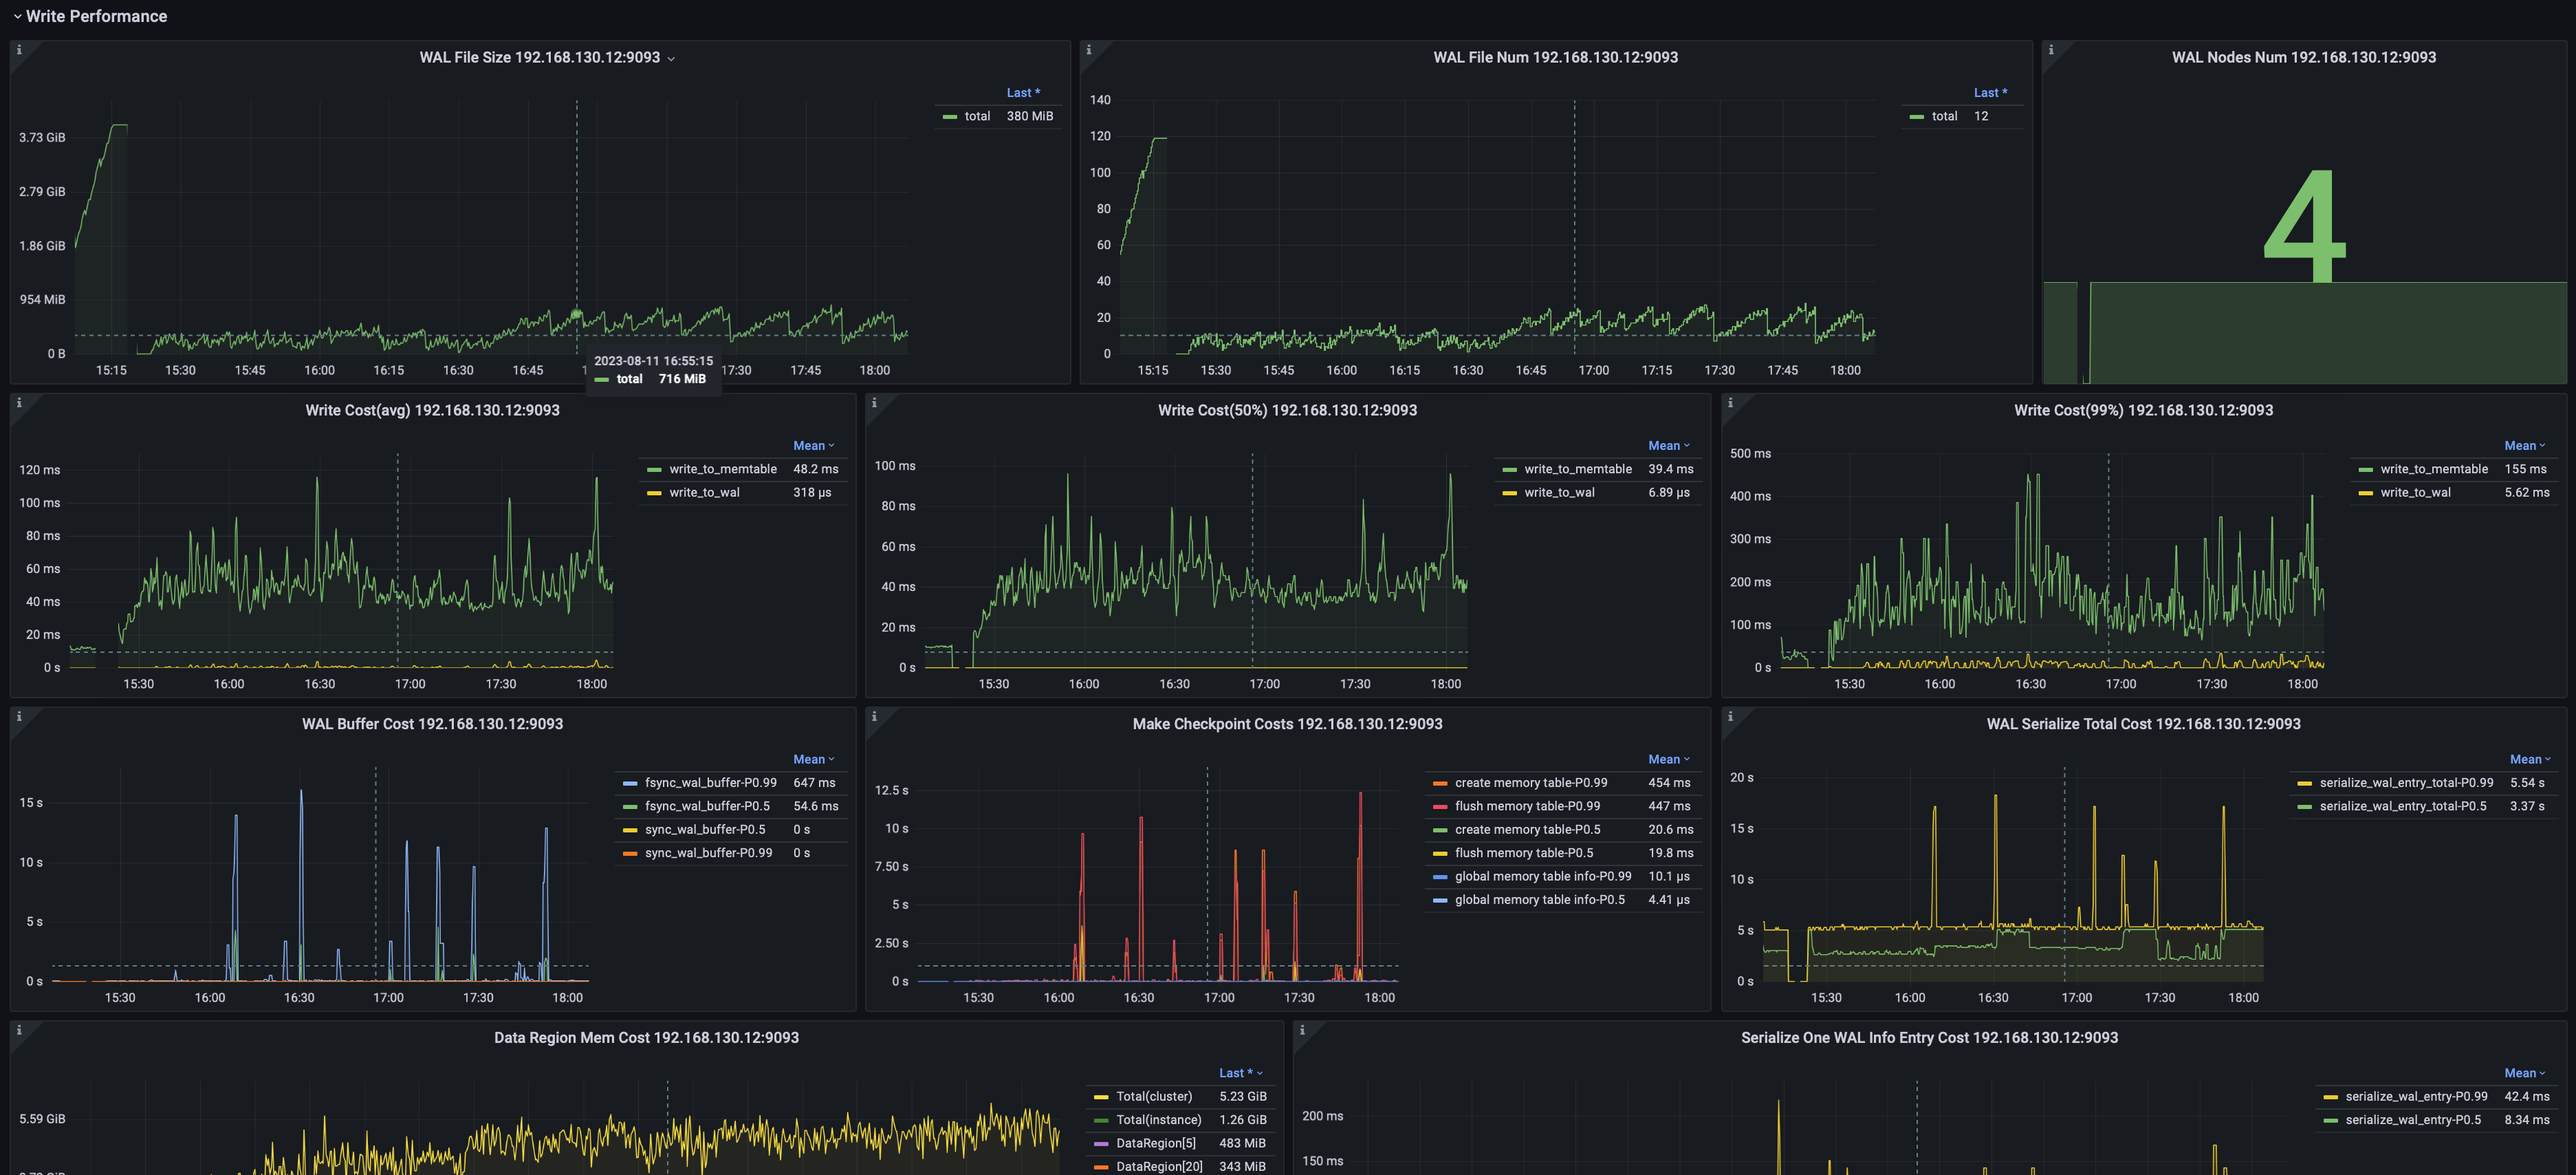
2.2 Data Writing
Including but not limited to:
- Average write latency, median latency, and the 99% percentile latency.
- Number and size of WAL files.
- WAL flush SyncBuffer latency per node.
2.3 Data Querying
Including but not limited to:
- Time series metadata query load time per node.
- Time series data read duration per node.
- Time series metadata modification duration per node.
- Chunk metadata list loading time per node.
- Chunk metadata modification duration per node.
- Chunk metadata-based filtering duration per node.
- Average time required to construct a Chunk Reader.

2.4 Storage Engine
Including but not limited to:
- File count and size by type.
- Number and size of TsFiles at different processing stages.
- Task count and execution duration for various operations.

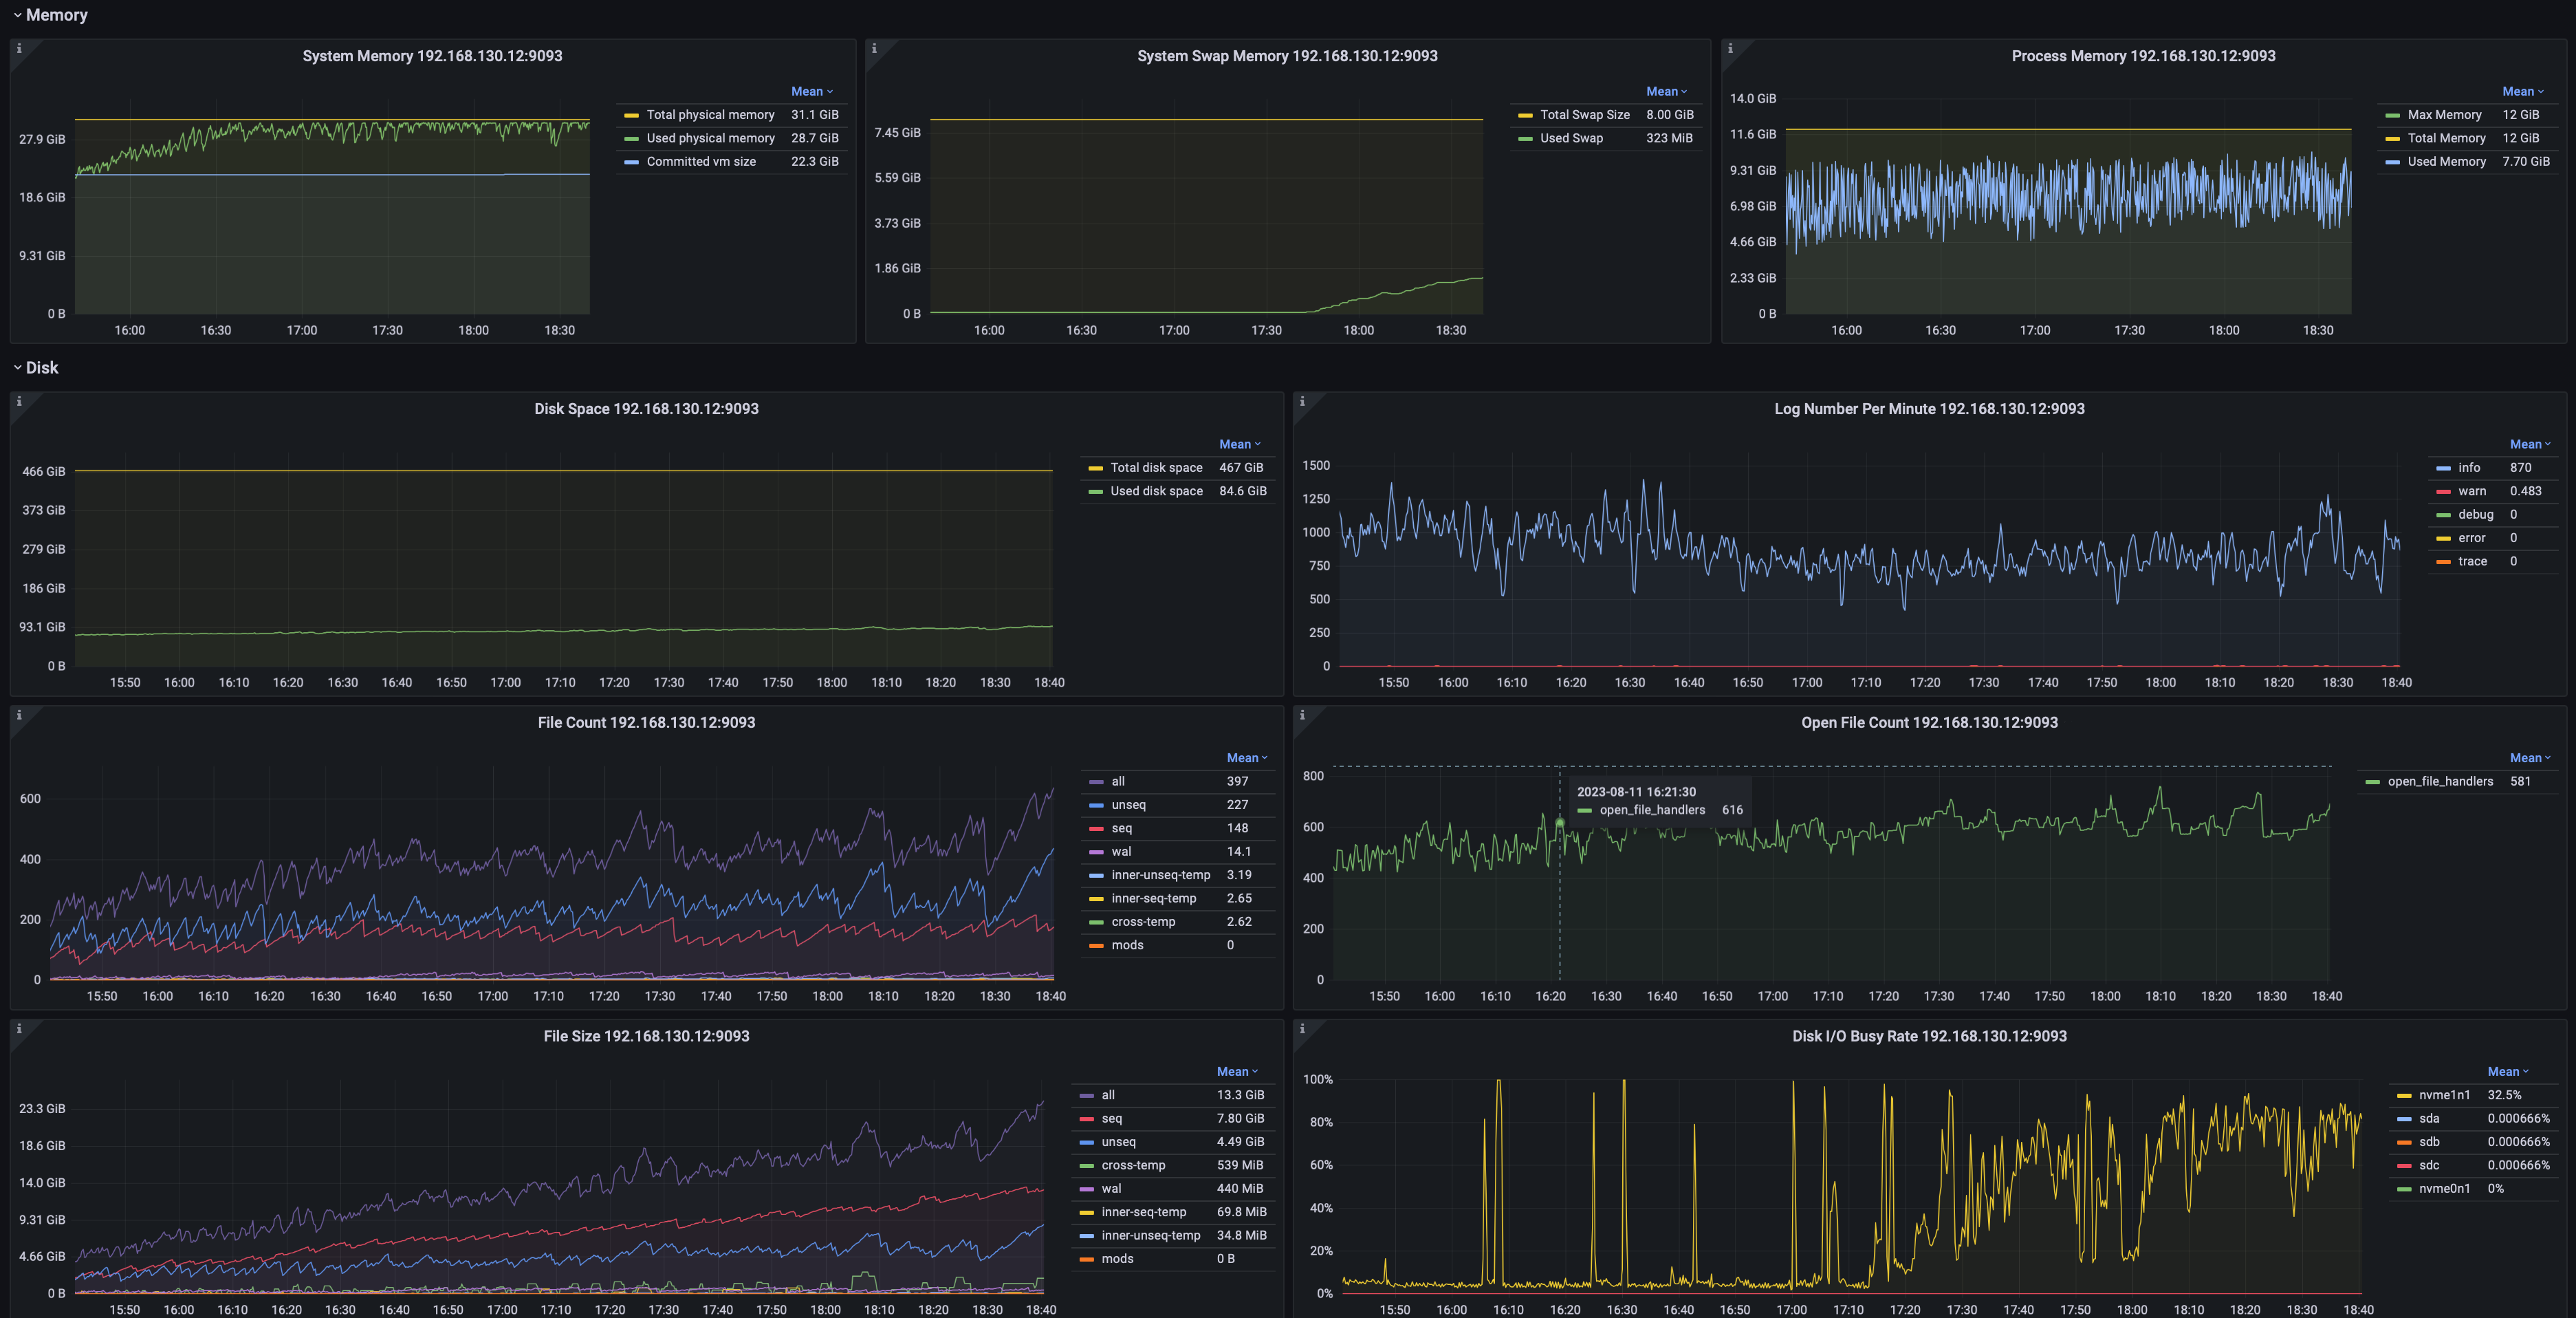
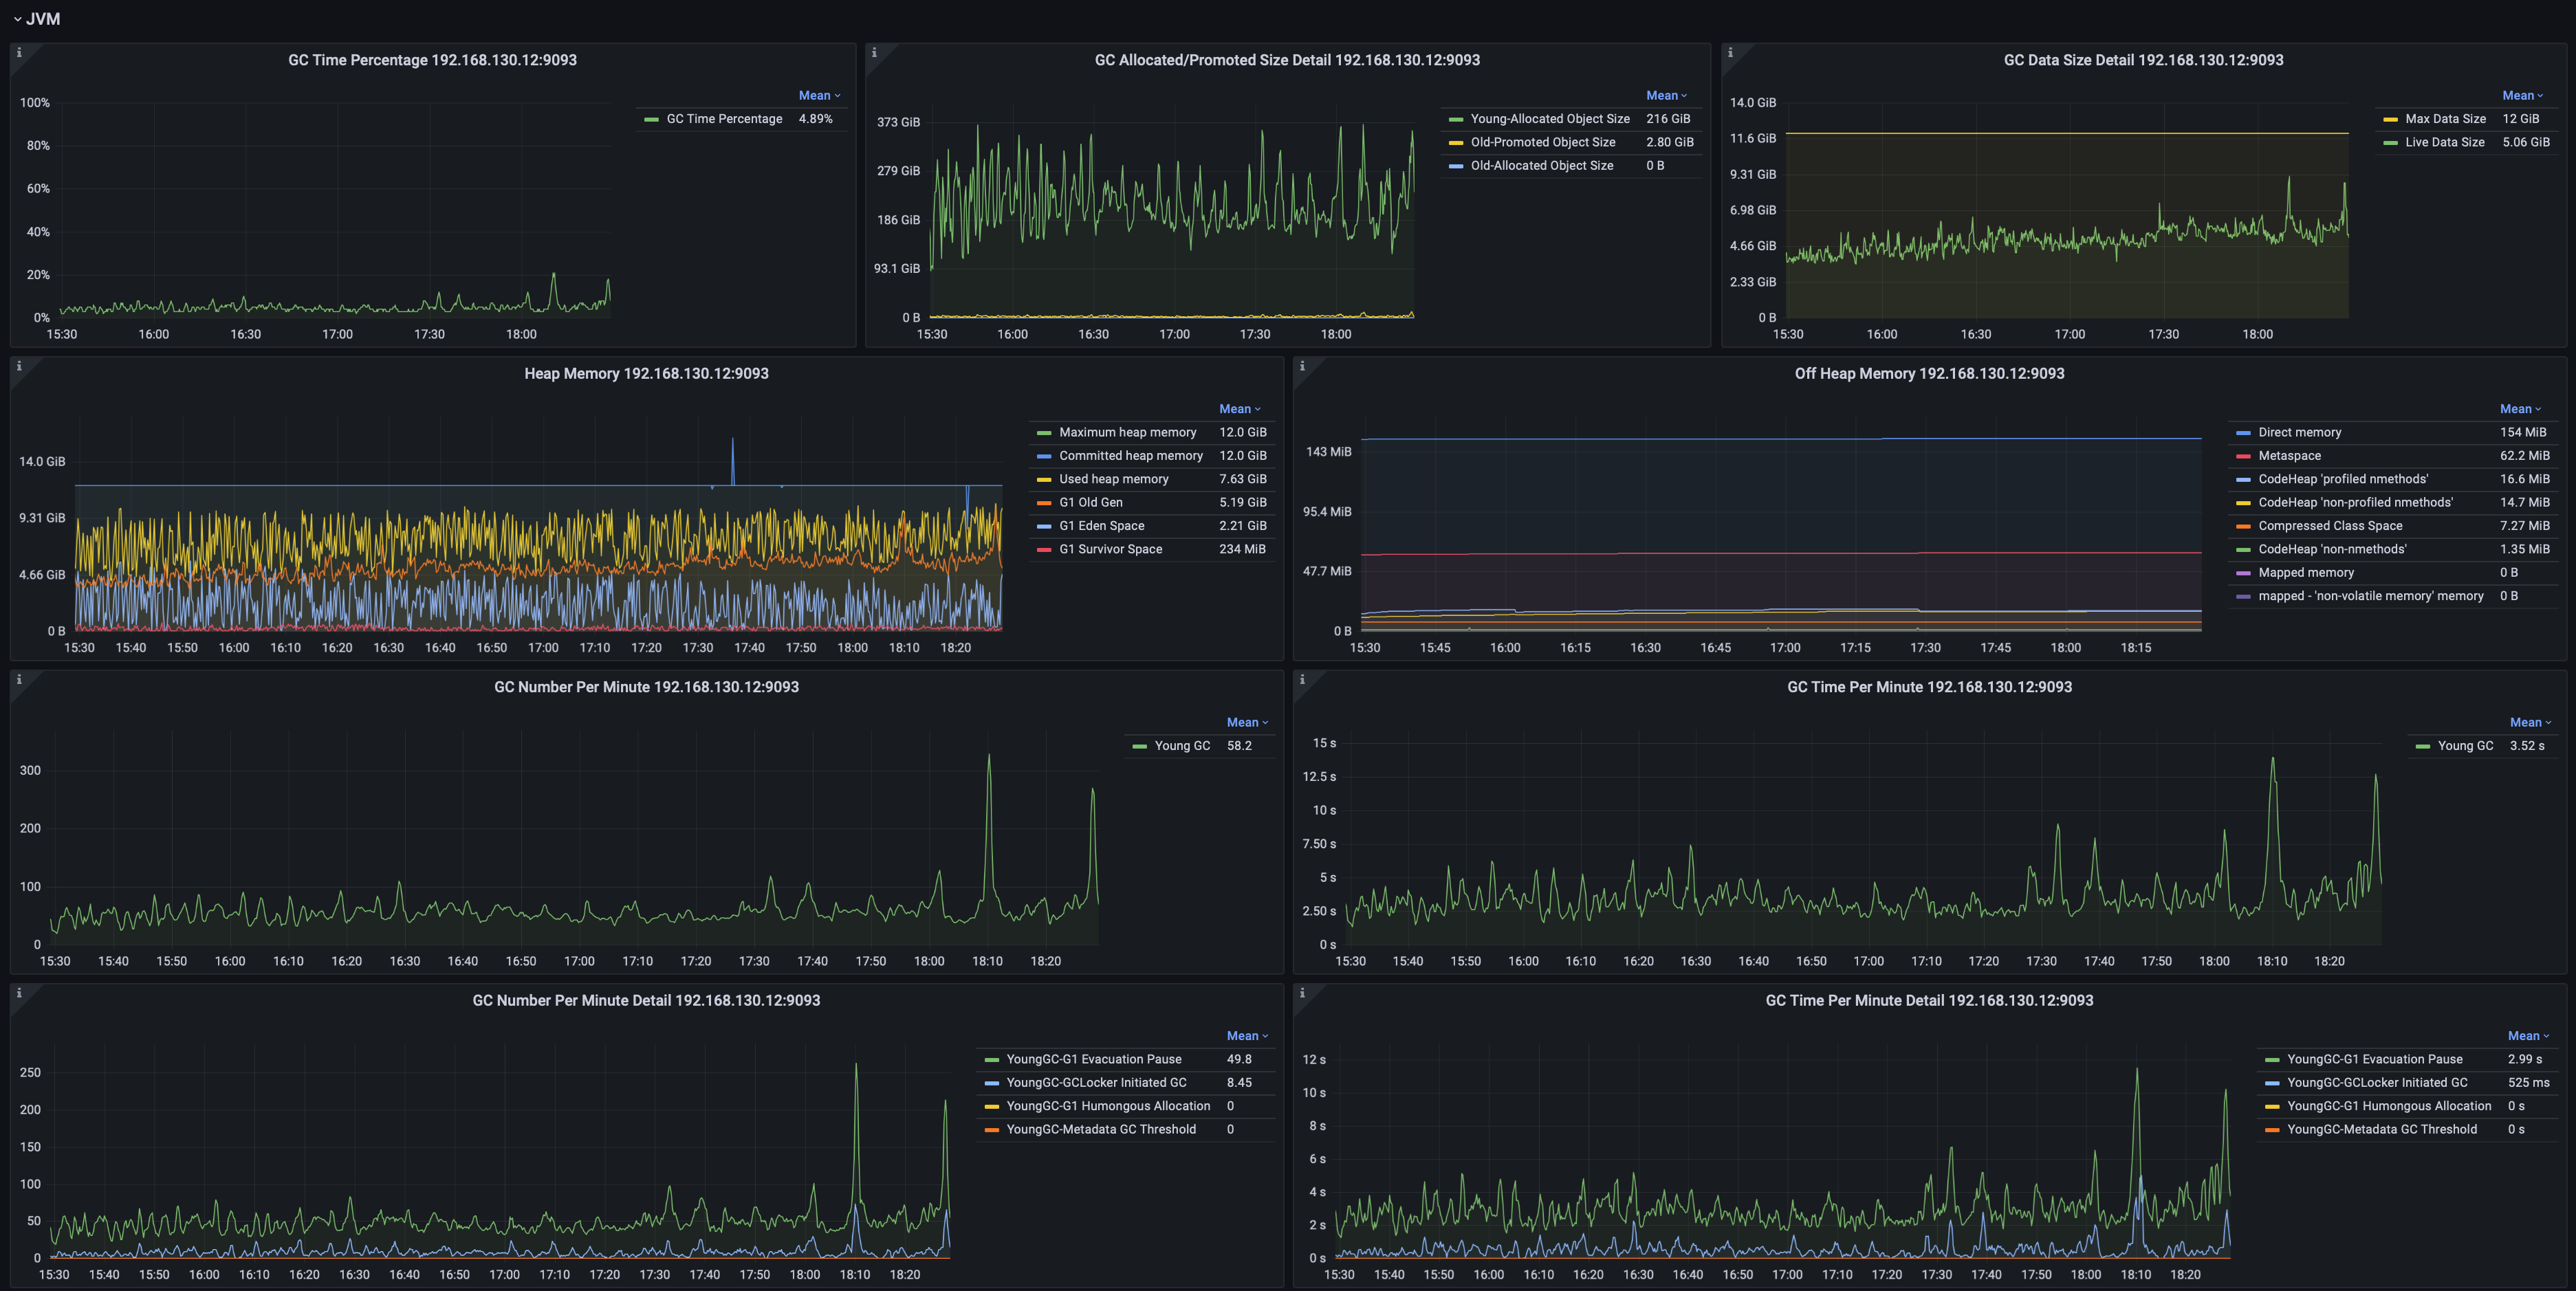
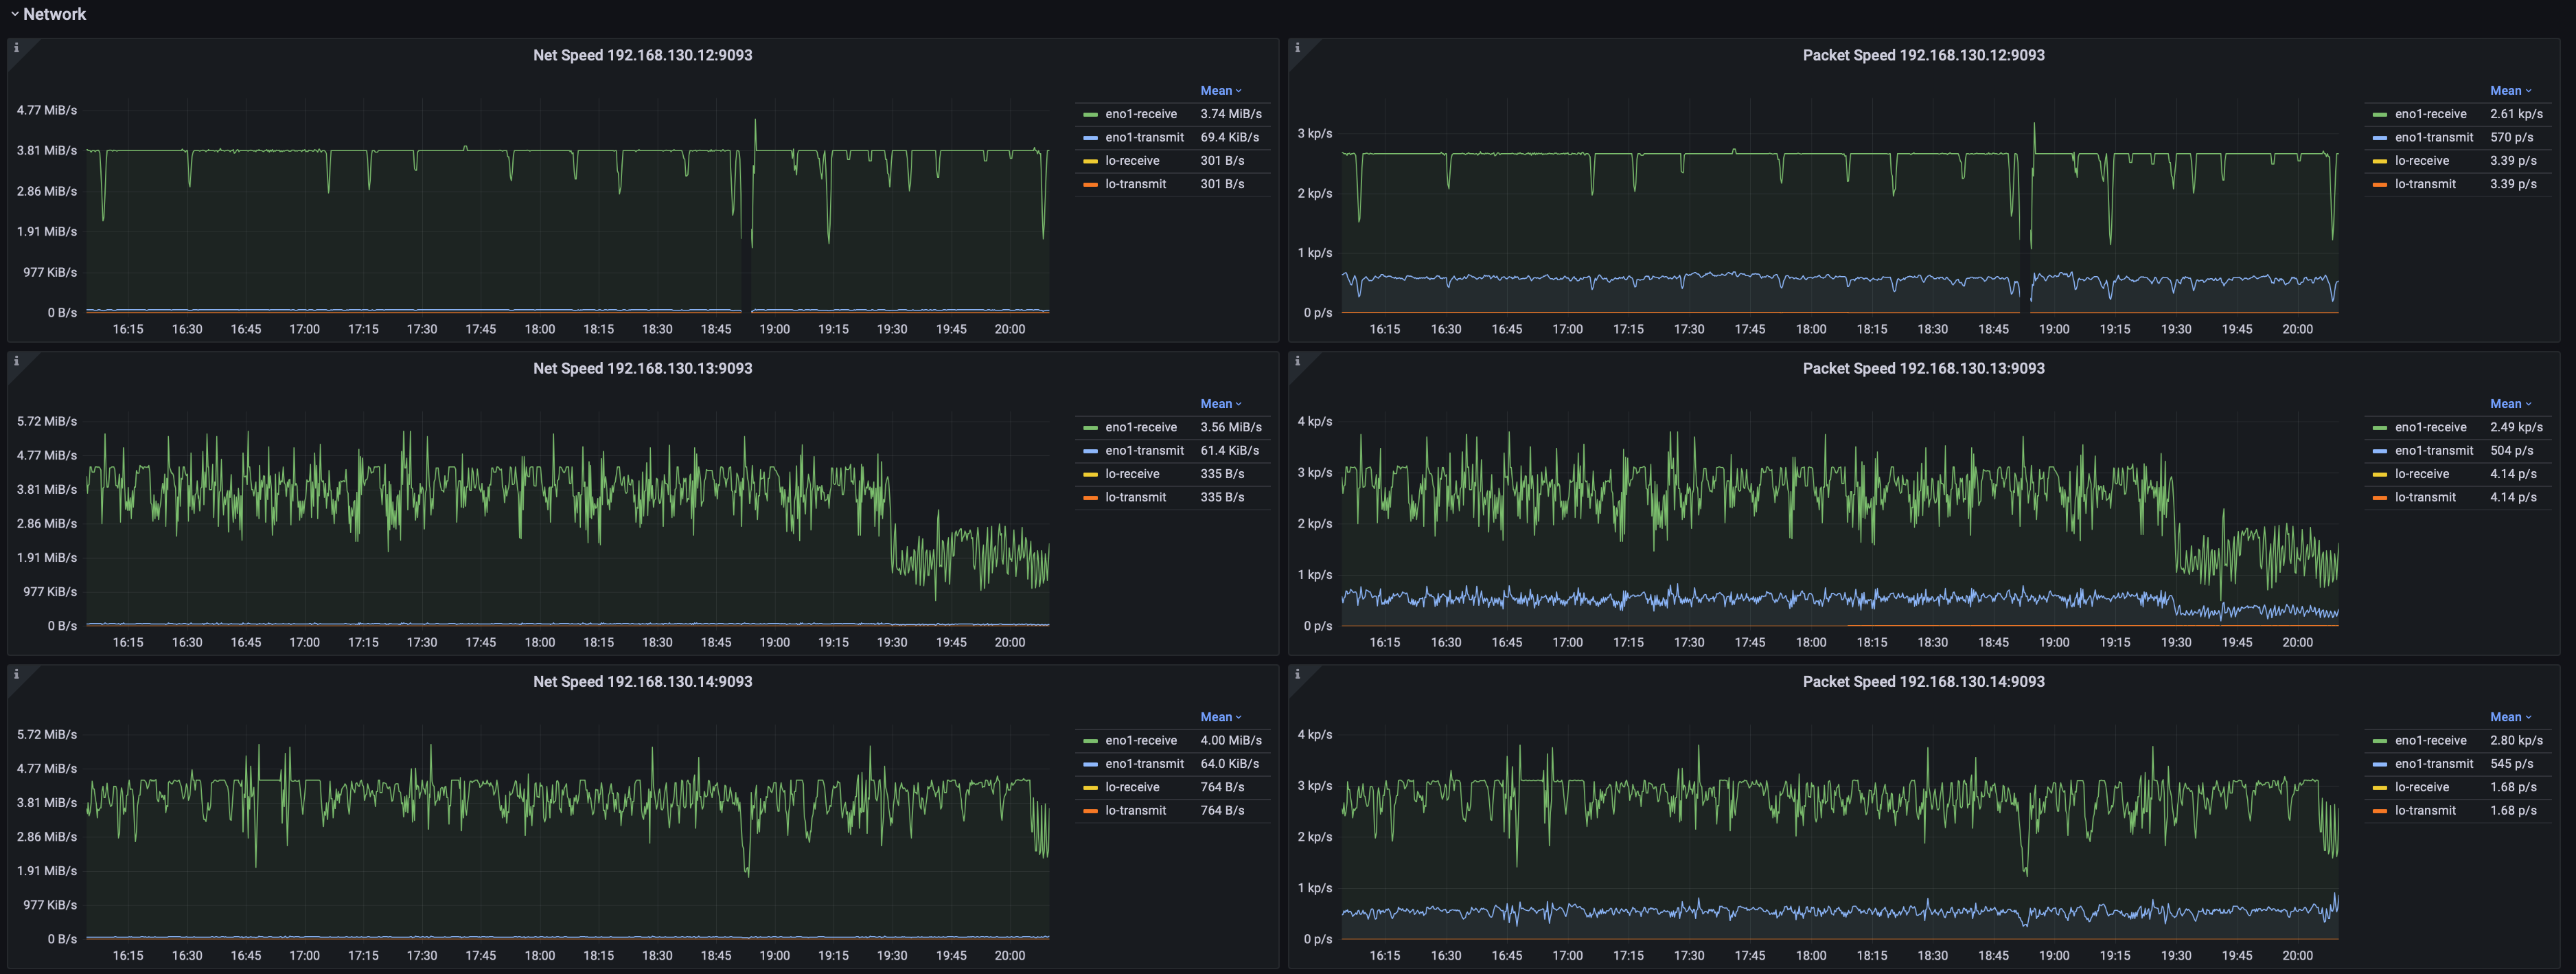
2.5 System Monitoring
Including but not limited to:
- System memory, swap memory, and process memory usage.
- Disk space, file count, and file size statistics.
- JVM garbage collection (GC) time percentage, GC events by type, GC data volume, and heap memory utilization across generations.
- Network throughput and packet transmission rate.
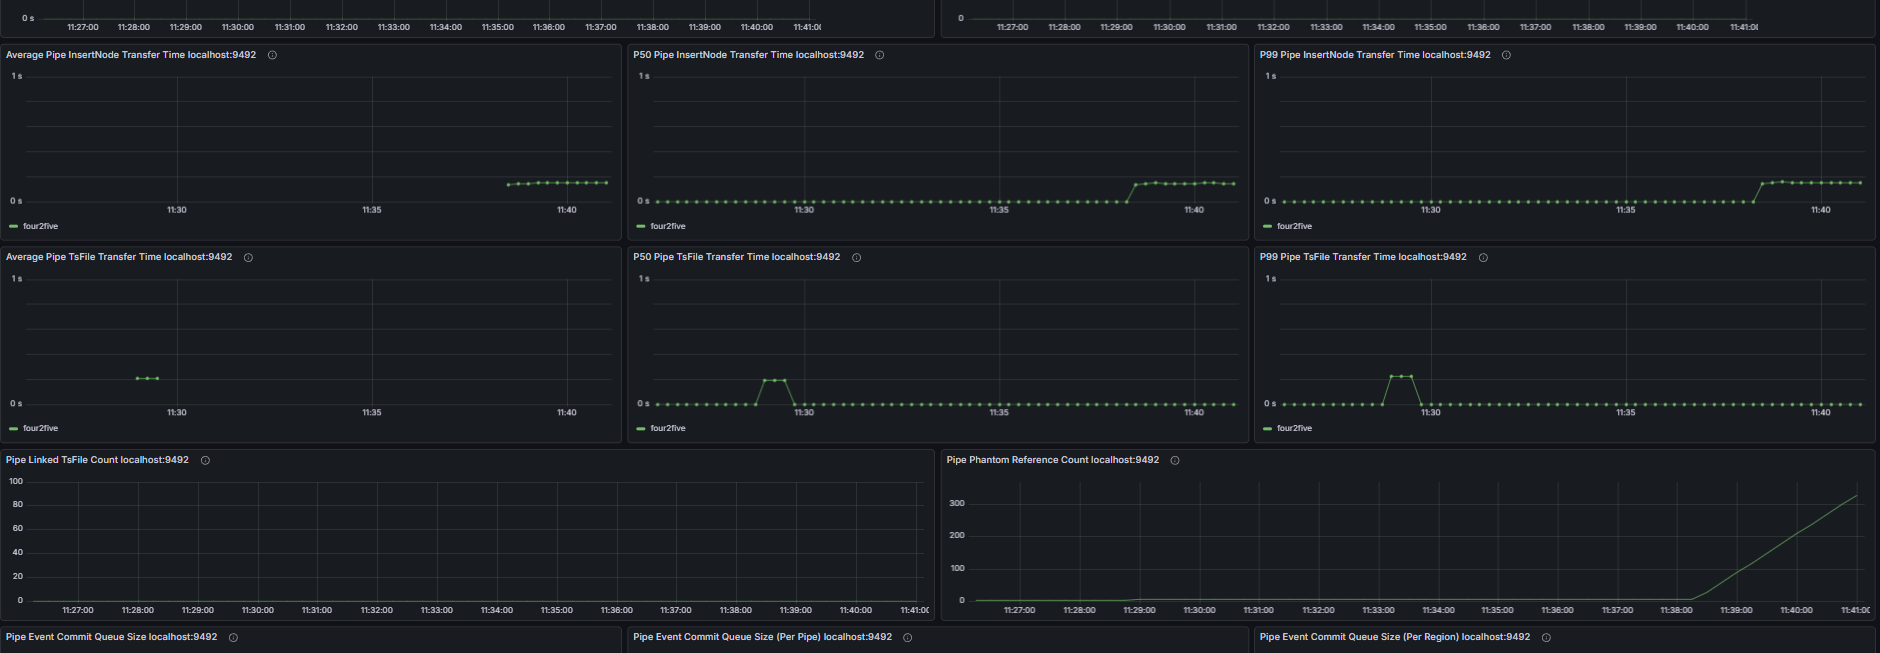
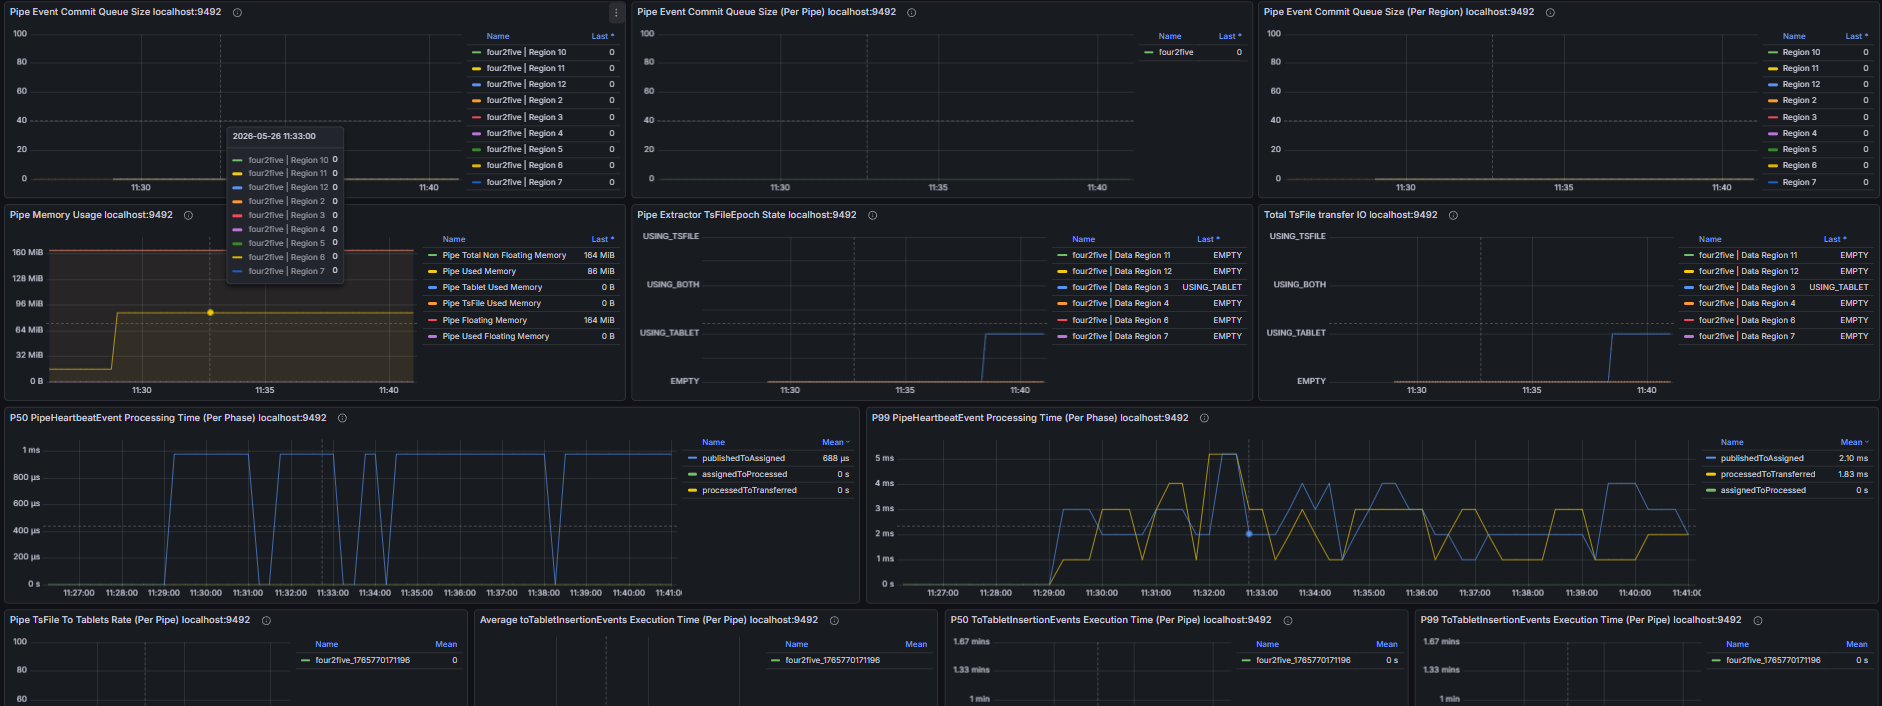
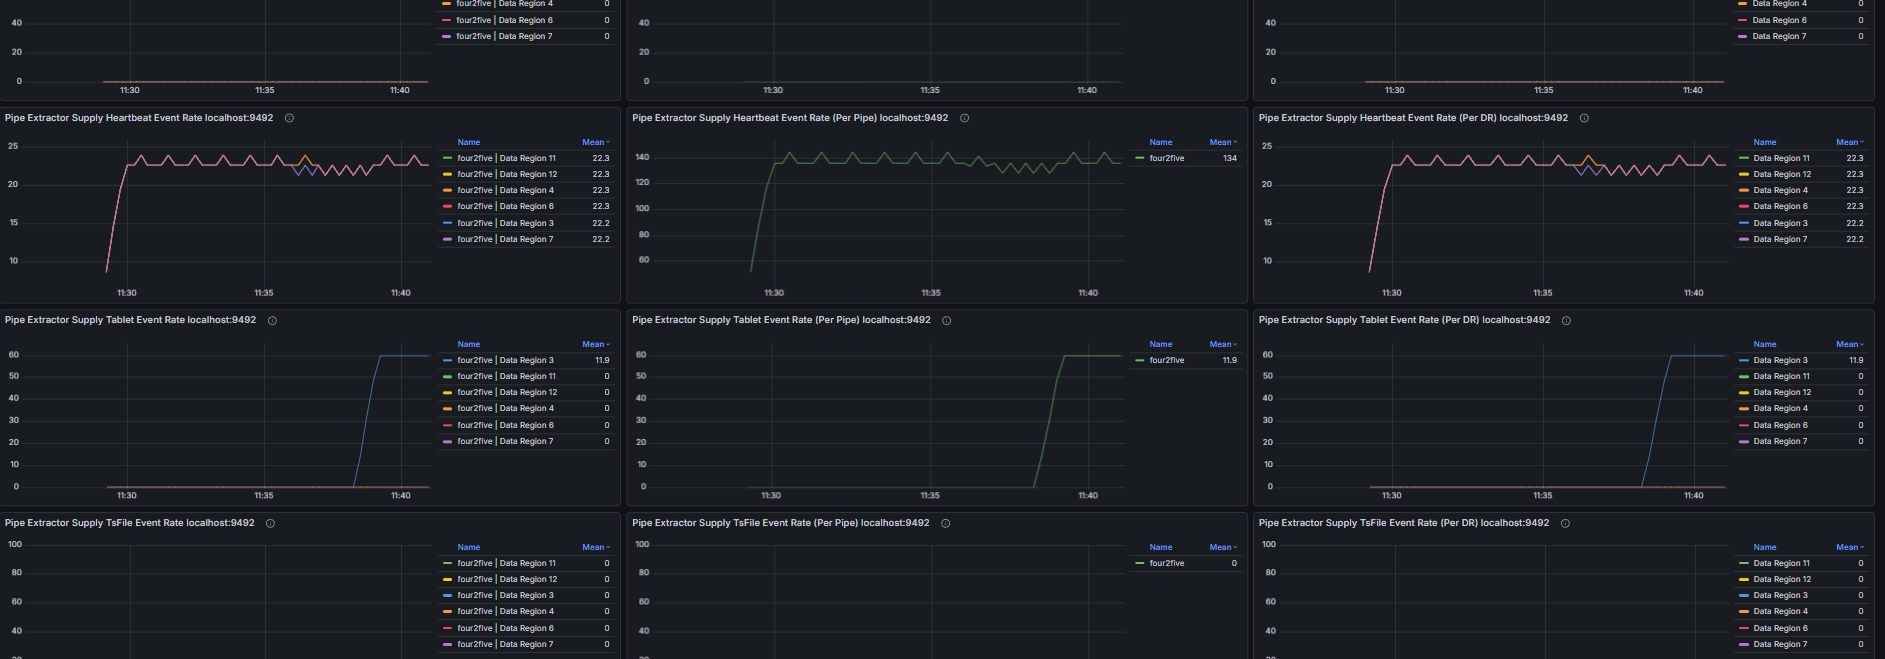
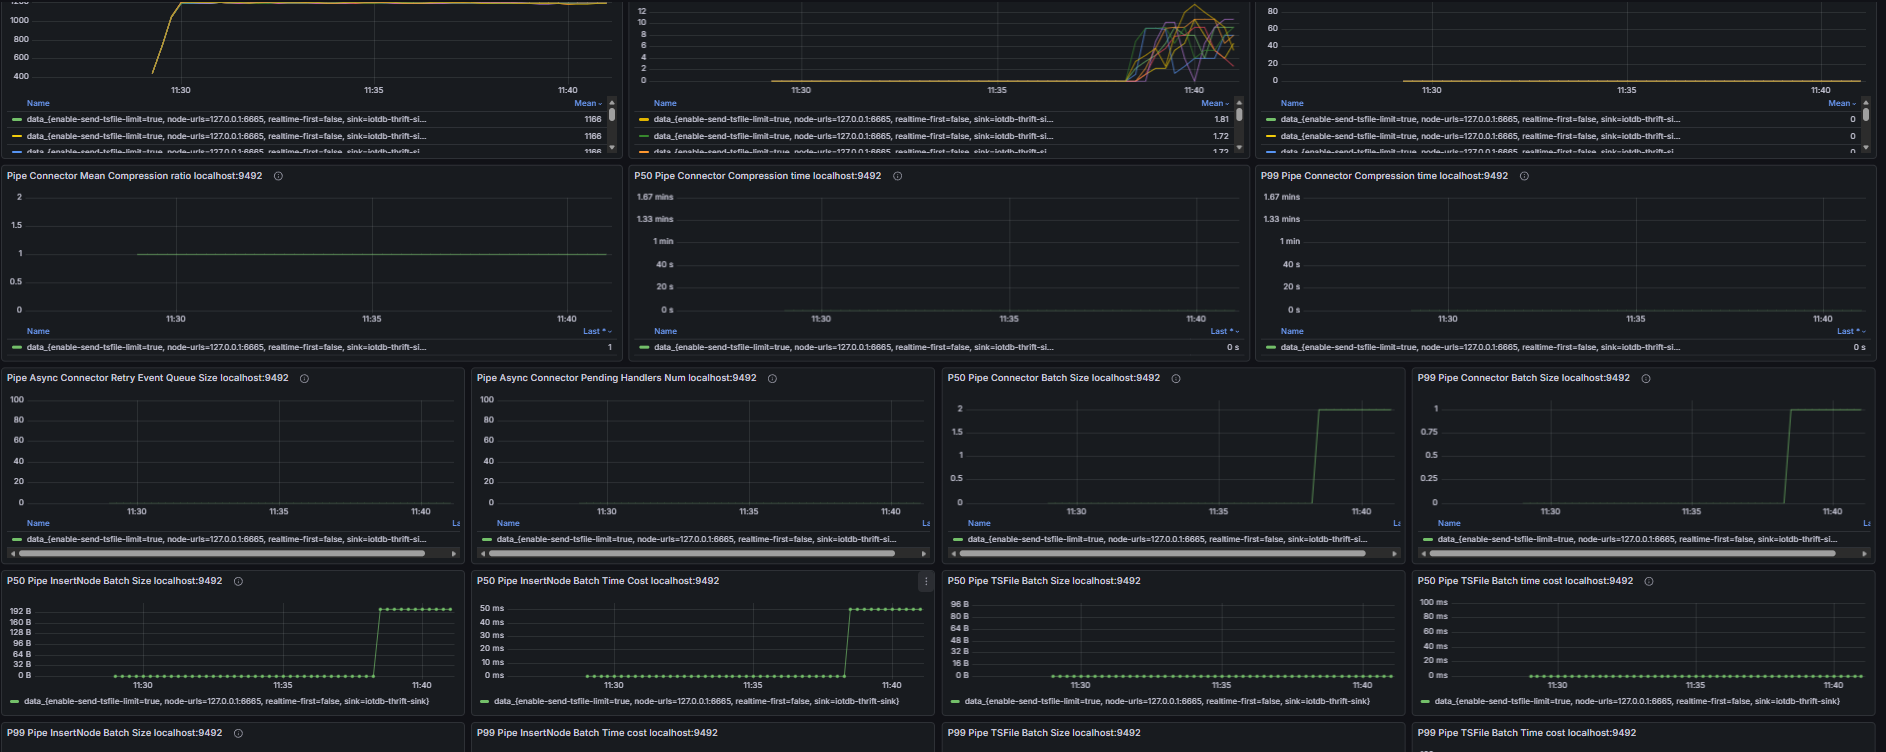
2.6 Data Synchronization
Including but not limited to:
- Pipe event commit queue size, number of unassigned Pipe events
- Number of unprocessed events in the Source queue, Source event feeding rate, Processor event processing rate
- Number of untransmitted events for all Pipe Sinks/Sources, transmission event rate of Pipe connectors
- Retry queue size and pending handler count of Pipe Sinks; total data size before and after compression and compression duration of Pipe Sinks; batch size and batch interval distribution of Pipe Sinks
- Pipe memory usage and capacity, number of Pipe phantom references, quantity and total size of linked TsFiles, disk bytes read for TsFile transmission via Pipe